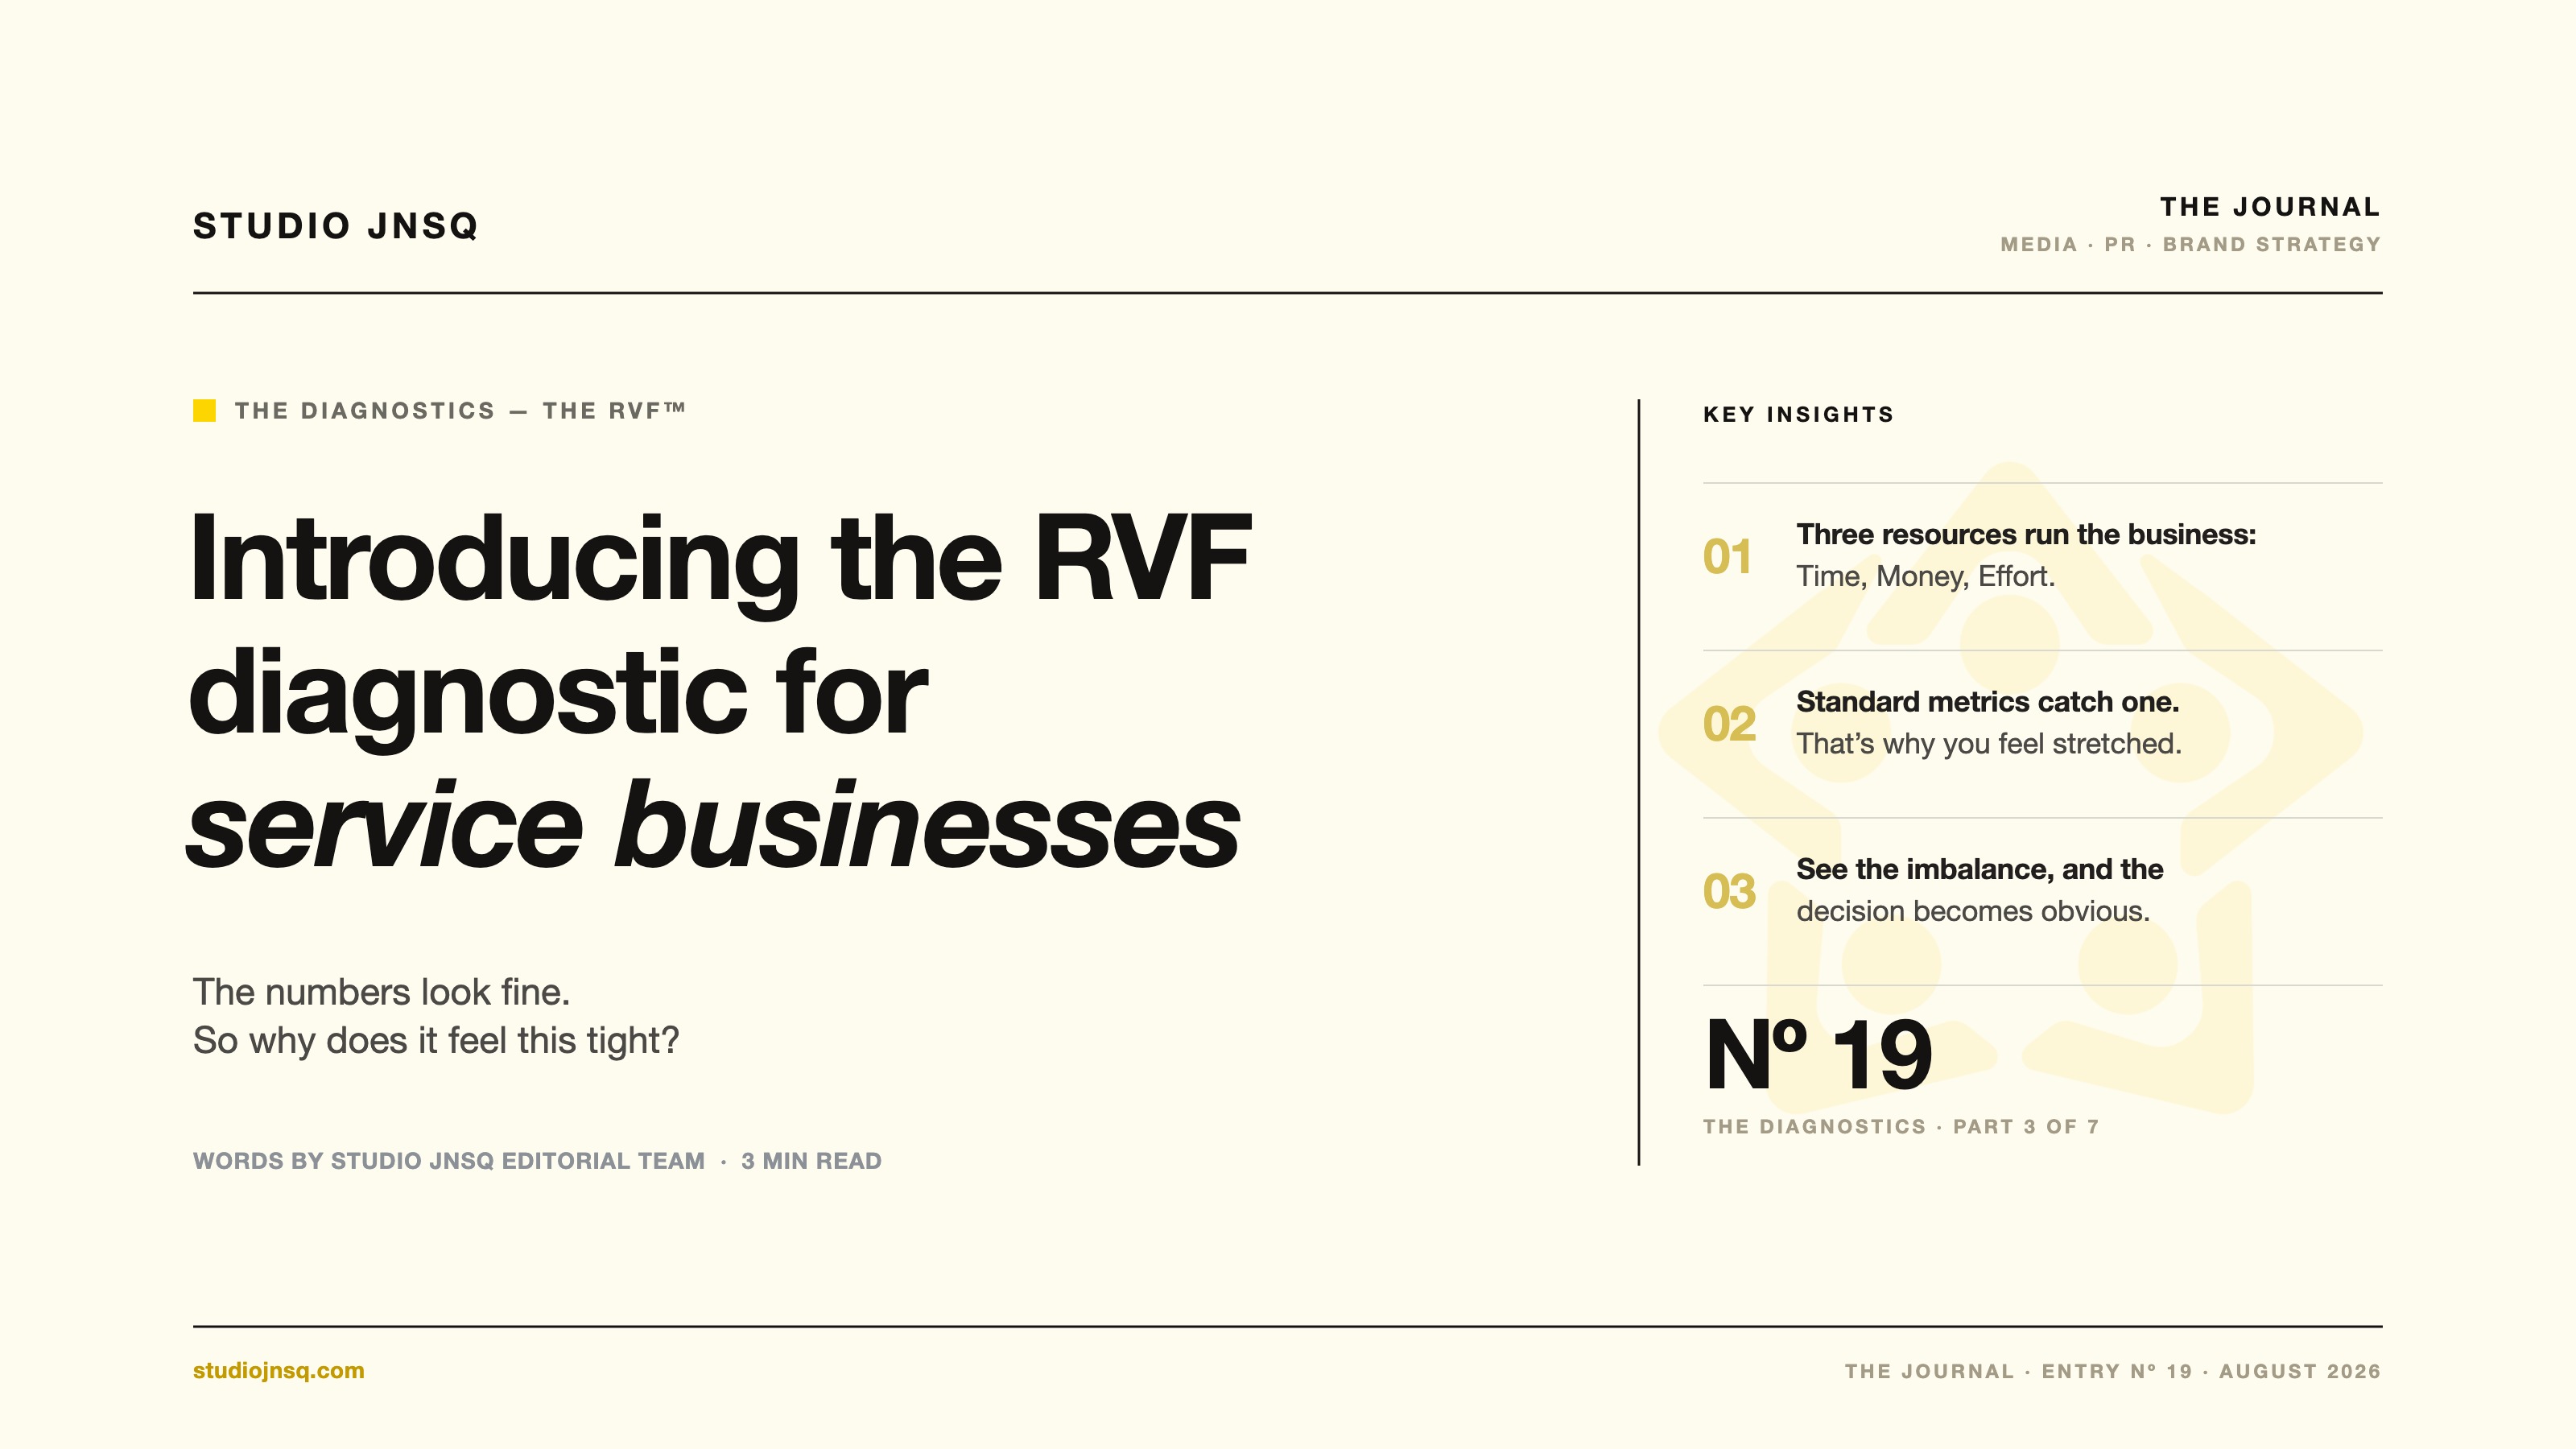
This is Part 3 of The Diagnostics. We have covered the MAD™ and RVF™ frameworks. Now: how the RVF™ diagnostic works specifically for service-based businesses.
If you run a service-based business, you already know that the standard business metrics do not capture everything. Revenue looks fine but you are exhausted. Margins are healthy but growth feels stuck. The disconnect is not in your numbers; it is in how you are allocating your three real resources. Most diagnostics are built for product businesses. They measure inventory turns, gross margin on goods, cost of goods sold. None of that maps cleanly onto a consultancy, an agency, a law firm, or a coaching practice. You are selling expertise, attention, and execution capacity, and those do not fit neatly into a spreadsheet row.
Why do service businesses need their own diagnostic?
A product business converts raw materials into goods and measures margin on the conversion. A service business converts three resources, Time, Money, and Effort, into outcomes for clients. When the conversion is efficient, you have a scalable, profitable practice. When it is not, you have a business that looks healthy on paper while grinding you down in reality.
The tools built for product businesses cannot see this. Revenue per employee, EBITDA, gross margin: these are useful numbers, but they do not tell you whether you are spending forty hours a week on work that a junior hire could own, or whether your pricing reflects the actual Effort required. McKinsey's research on resource allocation found that 83% of executives identify resource reallocation as the top management lever for growth, yet most businesses never audit their resource deployment at the founder level.
What does the RVF™ measure that other tools miss?
Other diagnostics ask what your revenue is. The RVF™ asks what your revenue is worth relative to what it cost you to generate it, across all three resource dimensions. That is a fundamentally different question.
It looks at Time: how many hours are going into client delivery versus business development versus operations? It looks at Money: where is capital being deployed, and is that deployment proportional to the returns? It looks at Effort: what cognitive and relational energy is being spent, and is it being spent on the highest-value activities?
Most founders have a sense that something is off in at least one of these areas. They are right; they do not know which one is the root cause and which ones are symptoms. Harvard Business Review's research on customer lifetime value makes a parallel point: most companies misidentify where value is being created and destroyed because they measure outputs without mapping the inputs that generated them. The RVF™ makes the input picture visible.
The question is not whether you are working hard enough. It is whether the work is compounding.
How do you use your RVF™ results to make better decisions?
Your RVF™ results come back as a profile across the three resource dimensions, with a clear picture of where you are over-invested relative to returns and where you have room to deploy more. This is not abstract: it translates directly into decisions.
If you are over-indexed on Time relative to Money, the diagnostic points toward pricing strategy or capacity restructuring. If Effort is disproportionately high relative to both revenue and time, it often signals misalignment between what you are doing and what the market values. If Money is being deployed without proportional return, it surfaces where resources are leaking.
The goal is not to optimize for one resource at the expense of the others. It is to find the allocation that lets all three compound together, which is what a healthy, scalable service business looks like.
The RVF™ diagnostic is free to start. You get your scores immediately, and the full report walks you through what each dimension means for your specific business and what to do next.
"Standard metrics tell you where the money went. The RVF™ tells you whether it built anything worth keeping. For service businesses, that distinction is the difference between scaling and stalling." — Jerico Lugo, Founder, Studio JNSQ
Up next in The Diagnostics: What Happens After Your MAD™ Diagnostic. Part 4 drops on Wednesday, August 19.